Bluewave vs Uptime Kuma: A Real-World Comparison for Monitoring Uptime and Beyond
In today’s digital landscape, service reliability isn’t just a technical requirement—it’s a business imperative. Whether you’re running a small personal blog or managing enterprise-level infrastructure, knowing when your systems are down is critical. This is where uptime monitoring tools come into play, providing visibility into service availability and performance.
This article examines two popular self-hosted monitoring solutions: Uptime Kuma and BlueWave Uptime. We’ll explore their features, deployment processes, strengths, and limitations to help you make an informed decision for your monitoring needs.
Understanding Uptime Monitoring
Before diving into the comparison, let’s clarify what uptime monitoring is and why it matters.
Uptime monitoring is the process of continuously checking whether a service, website, or application is operational and accessible. It provides critical insights into:
- Service availability
- Response times
- Performance trends
- Potential bottlenecks
- Historical reliability data
Effective monitoring enables teams to:
- Respond quickly to outages before users report them
- Meet service level agreements (SLAs)
- Identify patterns in system failures
- Build trust with customers through transparent status reporting
- Make data-driven infrastructure decisions
Now, let’s examine our two contenders.
What is Uptime Kuma?
 Uptime Kuma is an open-source, self-hosted monitoring tool designed with simplicity and usability in mind. Created by Louis Lam, it has rapidly gained popularity in the DevOps community for its intuitive interface and straightforward setup process.
Key Features
- Monitoring Capabilities: Supports HTTP(s), TCP, Ping, DNS, and more
- Extensive Notification Options: Integrates with over 90 notification services, including Telegram, Discord, Slack, and email
- Status Pages: Create customizable public or private status pages
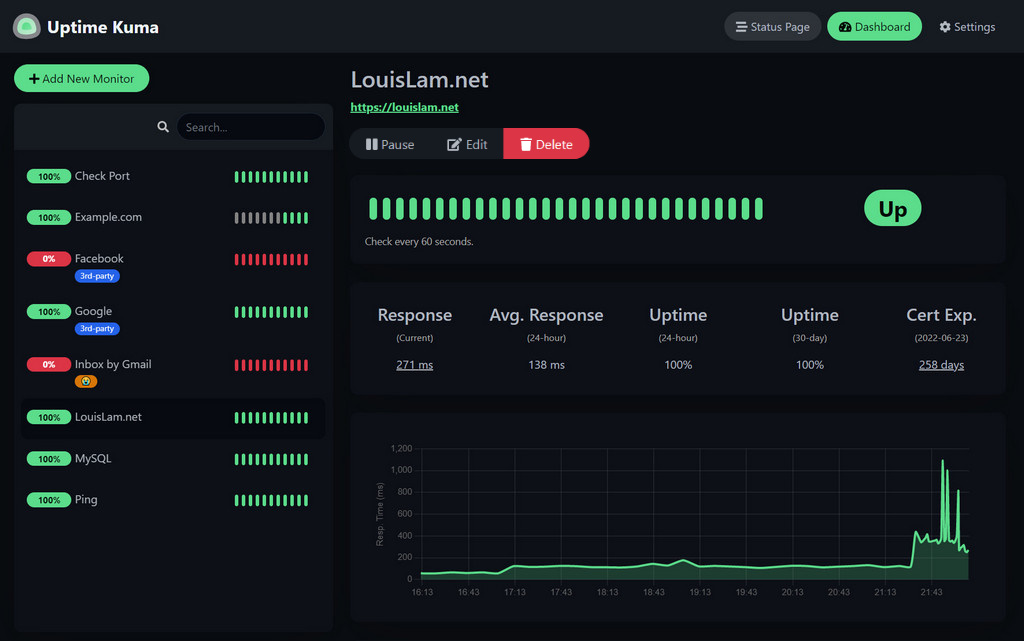
- Visualization: Clean, responsive dashboard with uptime graphs and metrics
- Authentication: Secure access control with multi-user support
- API: RESTful API for integration with other tools
- Multi-Language Support: Available in numerous languages
Strengths
- Simplicity: The UI is clean, intuitive, and requires minimal training
- Quick Setup: Can be deployed in minutes with Docker
- Low Resource Usage: Runs efficiently on modest hardware
- Active Community: Regular updates and robust community support
- Lightweight Database: Uses SQLite, simplifying deployment
Limitations
- Limited Metric Depth: Primarily focused on uptime rather than detailed performance metrics
- Basic Alerting Logic: Notification rules are somewhat limited compared to enterprise solutions
- Scaling Challenges: May face performance issues with hundreds of monitored endpoints
- Limited Customization: Dashboard and reporting options are relatively fixed
What is BlueWave Uptime?
BlueWave Uptime is a comprehensive server monitoring application that offers more extensive features for tracking and analyzing server performance. It provides in-depth insights into server health, making it suitable for users requiring detailed monitoring capabilities.
Key Features
- Comprehensive Monitoring: Tracks server uptime, performance metrics, and resource utilization
- Advanced Metrics: Monitors CPU, memory, disk usage, and network performance
- Customizable Dashboards: Offers flexible and detailed visualization options
- Sophisticated Alerting: Complex alerting rules with escalation options
- Data Retention: Long-term storage of performance data for trend analysis
- Integration Capabilities: Connects with various services for enhanced monitoring
- Scalability: Designed to handle monitoring of multiple servers efficiently
Strengths
- Depth of Monitoring: Goes beyond simple uptime checks to provide comprehensive server health data
- Extensibility: Highly customizable for specific monitoring needs
- Scalable Architecture: Efficiently handles large numbers of monitored endpoints
- Data Analysis: Provides robust tools for analyzing performance trends
- Enterprise-Ready: Suitable for professional and large-scale deployments
Limitations
- Steeper Learning Curve: More complex to set up and configure
- Higher Resource Requirements: Needs more system resources than simpler solutions
- Configuration Complexity: More options mean more complexity in initial setup
- Documentation Gaps: Some advanced features may lack detailed documentation
Deployment Comparison
Uptime Kuma Deployment
Docker Installation (Recommended)
docker run -d --restart=always -p 3001:3001 -v uptime-kuma:/app/data --name uptime-kuma louislam/uptime-kuma:1
After running this command, access Uptime Kuma at http://localhost:3001.
Non-Docker Installation
# Clone the repository
git clone https://github.com/louislam/uptime-kuma.git
cd uptime-kuma

# Install dependencies
npm ci --production

# Build the frontend
npm run download-dist

# Start the application
node server/server.js
For persistent operation, consider using PM2:
npm install pm2 -g
pm2 start server/server.js --name uptime-kuma
pm2 startup
pm2 save
Setting Up Uptime Kuma as a System Service
For a more robust setup on Linux systems, you can create a systemd service file:
sudo nano /etc/systemd/system/uptime-kuma.service
Add the following content:
[Unit]
Description=Uptime Kuma
After=network.target

[Service]
Type=simple
User=<your-user>
WorkingDirectory=/path/to/uptime-kuma
ExecStart=/usr/bin/node server/server.js
Restart=on-failure
Environment=NODE_ENV=production

[Install]
WantedBy=multi-user.target
Replace <your-user> with your username and adjust the path to your Uptime Kuma installation.
Enable and start the service:
sudo systemctl daemon-reload
sudo systemctl enable uptime-kuma.service
sudo systemctl start uptime-kuma.service
You can check the status of the service with:
sudo systemctl status uptime-kuma.service
BlueWave Uptime Deployment
Docker Installation
# Clone the repository
git clone https://github.com/abhayjoshi201/bluewave-uptime.git
cd bluewave-uptime

# Build and start the Docker containers
docker-compose up -d
Non-Docker Installation for Developers
For developers who prefer to run BlueWave Uptime directly on their system without Docker, here’s a detailed guide:
Prerequisites: - Node.js (v14 or later) - MongoDB (v4.4+) - Redis (v6+) - Git
Backend Setup:
# Clone the repository
git clone https://github.com/abhayjoshi201/bluewave-uptime.git
cd bluewave-uptime/server

# Install dependencies
npm install

# Create configuration file
cp .env.example .env

# Edit the .env file to include your MongoDB and Redis connection details
# nano .env or vim .env

# Start the server in development mode
npm run dev

# Alternatively, for production
npm run build
npm run start
Frontend Setup:
# Navigate to the frontend directory
cd ../client

# Install dependencies
npm install

# Create configuration file
cp .env.example .env

# Edit the .env file to set the API URL
# nano .env or vim .env

# Start the development server
npm run dev

# For production build
npm run build
Setting Up Service Files (For Linux Systems)
To run BlueWave Uptime as a system service, create systemd service files:
BlueWave Backend Service:
sudo nano /etc/systemd/system/bluewave-backend.service
Add the following content:
[Unit]
Description=BlueWave Uptime Backend Service
After=network.target mongodb.service redis.service

[Service]
Type=simple
User=<your-user>
WorkingDirectory=/path/to/bluewave-uptime/server
ExecStart=/usr/bin/node dist/index.js
Restart=on-failure
Environment=NODE_ENV=production

[Install]
WantedBy=multi-user.target
BlueWave Frontend Service:
sudo nano /etc/systemd/system/bluewave-frontend.service
Add the following content:
[Unit]
Description=BlueWave Uptime Frontend Service
After=network.target bluewave-backend.service

[Service]
Type=simple
User=<your-user>
WorkingDirectory=/path/to/bluewave-uptime/client
ExecStart=/usr/bin/serve -s dist -l <port>
Restart=on-failure

[Install]
WantedBy=multi-user.target
Enable and start the services:
sudo systemctl daemon-reload
sudo systemctl enable bluewave-backend.service
sudo systemctl enable bluewave-frontend.service
sudo systemctl start bluewave-backend.service
sudo systemctl start bluewave-frontend.service
Environment Variables Configuration
BlueWave Uptime requires specific environment variables for both the client and server components. Here’s a comprehensive guide to help you set up these variables correctly:
Client Environment Variables:
Create a .env file in the client directory with the following variables:
| ENV Variable Name | Required/Optional | Type | Description | Accepted Values |
|---|---|---|---|---|
| VITE_APP_API_BASE_URL | Required | string |
Base URL of server | {host}/api/v1 |
| VITE_APP_LOG_LEVEL | Optional | string |
Log level | "none" | "error" | "warn" | "debug" |
| VITE_APP_DEMO | Optional | boolean |
Demo server or not | true | false |
Sample client .env file:
VITE_APP_API_BASE_URL="http://localhost:5000/api/v1"
VITE_APP_LOG_LEVEL="debug"
Server Environment Variables:
Create a .env file in the server directory with the following variables:
| ENV Variable Name | Required/Optional | Type | Description | Accepted Values |
|---|---|---|---|---|
| CLIENT_HOST | Required | string |
Frontend Host | |
| JWT_SECRET | Required | string |
JWT secret | |
| REFRESH_TOKEN_SECRET | Required | string |
Refresh JWT secret | |
| DB_TYPE | Optional | string |
Specify DB to use | MongoDB | FakeDB |
| DB_CONNECTION_STRING | Required | string |
MongoDB Database URL | |
| PORT | Optional | integer |
Server Port | |
| LOGIN_PAGE_URL | Required | string |
Login URL for email service | |
| REDIS_HOST | Required | string |
Redis database host | |
| REDIS_PORT | Required | integer |
Redis database port | |
| TOKEN_TTL | Optional | string |
Time for token to live | In vercel/ms format |
| REFRESH_TOKEN_TTL | Optional | string |
Time for refresh token to live | |
| PAGESPEED_API_KEY | Optional | string |
API Key for PageSpeed requests | |
| SYSTEM_EMAIL_HOST | Required | string |
System Email Host | |
| SYSTEM_EMAIL_PORT | Required | number |
System Email Port | |
| SYSTEM_EMAIL_ADDRESS | Required | string |
System Email Address | |
| SYSTEM_EMAIL_PASSWORD | Required | string |
System Email Password |
Sample server .env file:
CLIENT_HOST="http://localhost:5173"
JWT_SECRET="my_secret"
DB_TYPE="MongoDB"
DB_CONNECTION_STRING="mongodb://localhost:27017/uptime_db"
REDIS_HOST="127.0.0.1"
REDIS_PORT=6379
TOKEN_TTL="99d"
PAGESPEED_API_KEY=<api_key>
SYSTEM_EMAIL_HOST="smtp.gmail.com"
SYSTEM_EMAIL_PORT=465
SYSTEM_EMAIL_ADDRESS=<email_address>
SYSTEM_EMAIL_PASSWORD=<password>
REFRESH_TOKEN_SECRET="my_refresh"
REFRESH_TOKEN_TTL="99d"
API Documentation Access
BlueWave Uptime provides comprehensive API documentation following the OpenAPI specification. You can access this documentation at:
- Local development server:
http://localhost:{port}/api-docs - Demo server:
https://uptime-demo.bluewavelabs.ca/api-docs
Error Handling
BlueWave Uptime implements standardized error handling. Errors are returned in a consistent format:
{
  "success": false,
  "msg": "No token provided"
}
For developers extending BlueWave Uptime, errors should be structured with the following parameters:
| Name | Type | Default | Notes |
|---|---|---|---|
| status | integer |
500 | Standard HTTP codes |
| message | string |
“Something went wrong” | Error message |
| service | string |
“Unknown Service” | Name of service that threw the error |
Example error handling implementation:
const myRoute = async(req, res, next) => {
  try {
    const result = myRiskyOperationHere();
  }
  catch(error) {
    error.status = 404;
    error.message = "Resource not found";
    error.service = "serviceName";
    next(error);
    return;
  }
}
Note: Errors should be handled by middleware, not at the controller level.
Key Comparison Table
| Feature | Uptime Kuma | BlueWave Uptime |
|---|---|---|
| Setup Time | Very Easy (5-10 minutes) | Moderate (30+ minutes) |
| Backend Database | SQLite | MongoDB/Redis |
| Notifications | 90+ services including Email, Discord, Slack, Telegram | Customizable alerting system |
| Visualization | Built-in UI with basic graphs | Detailed and customizable dashboards |
| Monitoring Depth | Basic (ping, HTTP, TCP, DNS) | Comprehensive (health, metrics, resources) |
| Extendability | Limited | Highly extendable |
| Resource Usage | Low | Moderate to High |
| Mobile Interface | Responsive design | Requires additional setup |
| Community Support | Very active | Growing |
| Documentation | Comprehensive | Adequate but less detailed |
| Multi-user Support | Basic | Advanced with role-based access |
| Update Frequency | Regular | Periodic |
| Ideal Scale | Small to medium deployments | Medium to large deployments |
Real-World Use Cases
When to Choose Uptime Kuma
-
Small Business Website Monitoring Uptime Kuma is perfect for small businesses that need to monitor their website and a few critical services. Its simple setup and low maintenance requirements make it ideal for teams without dedicated DevOps personnel.
-
Personal Projects For developers monitoring personal projects or portfolios, Uptime Kuma provides essential monitoring without complexity. It can be deployed on a Raspberry Pi or minimal VPS.
-
Quick Deployment Needs When you need monitoring up and running quickly, Uptime Kuma’s five-minute setup process is hard to beat.
-
Status Page Requirements If your primary need is a public status page to communicate service health to customers, Uptime Kuma’s built-in status pages are excellent.
When to Choose BlueWave Uptime
-
Enterprise Infrastructure For organizations with complex infrastructure and numerous servers, BlueWave Uptime’s comprehensive monitoring capabilities provide the depth needed for proper oversight.
-
Performance Analysis Requirements If you need detailed performance metrics and analysis tools beyond simple uptime monitoring, BlueWave Uptime offers the depth required.
-
Custom Integration Needs Organizations with specific integration requirements will benefit from BlueWave Uptime’s extensibility and customization options.
-
Large-Scale Deployments For monitoring dozens or hundreds of endpoints, BlueWave Uptime’s architecture scales more effectively.
Combining Both Solutions
Some organizations may benefit from using both tools for different purposes:
- Uptime Kuma for public-facing status pages and basic service monitoring
- BlueWave Uptime for in-depth infrastructure monitoring and performance analysis
This approach leverages the strengths of each tool while mitigating their respective limitations.
Try It Yourself: Getting Started
Ready to try these monitoring solutions? Here’s how to get started with each:
Uptime Kuma Quick Start
- Ensure Docker is installed on your system
- Run the Docker command:
bash docker run -d --restart=always -p 3001:3001 -v uptime-kuma:/app/data --name uptime-kuma louislam/uptime-kuma:1 - Access the dashboard at
http://localhost:3001 - Create your first monitor by clicking “Add New Monitor”
- Configure notifications in the Settings section
BlueWave Uptime Quick Start
- Clone the repository:
bash git clone https://github.com/abhayjoshi201/bluewave-uptime.git - Navigate to the project directory:
bash cd bluewave-uptime - Edit the configuration files to match your environment
- Start the application:
bash docker-compose up -d - Access the dashboard at the configured URL
- Add your first server to begin monitoring
Conclusion
Both Uptime Kuma and BlueWave Uptime offer compelling options for self-hosted monitoring, but they serve different needs:
Uptime Kuma excels in simplicity, ease of deployment, and basic monitoring needs. It’s the perfect solution for small teams, personal projects, or situations where quick setup and minimal maintenance are priorities.
BlueWave Uptime shines in comprehensive monitoring, scalability, and customization. It’s better suited for larger organizations, complex infrastructures, or scenarios requiring detailed performance analysis.
The best choice depends on your specific requirements, technical expertise, and the scale of your infrastructure. For many users, starting with Uptime Kuma and migrating to BlueWave Uptime as needs grow is a practical approach.
Whatever you choose, implementing a monitoring solution is a critical step in ensuring the reliability and performance of your digital services. Both tools offer excellent starting points for taking control of your monitoring needs without relying on third-party services.
I encourage you to try both solutions and see which better fits your specific monitoring requirements. The investment in proper monitoring pays dividends in reduced downtime, improved user experience, and peace of mind.