Most homelab SOCs die the same way. Someone installs a SIEM, an IDS, an EDR agent and a SOAR platform over a few weekends. The dashboards look great. Then six months later the disks are full, half the agents are disconnected, and nobody can say whether the setup would catch anything at all.
The problem usually isn’t the tools. The lab got built as a collection of products when it should have been built as a pipeline. A useful homelab SOC answers one question again and again: if this specific behavior happened, would I see it, and would I know what to do?
This post lays out an architecture built around that question. It covers what to collect, where it goes, how you prove detections work, and how you keep the whole thing from rotting.
Design around the data path, not the product list
Every SOC, whatever its size, has the same stages. If one is weak, everything after it is weak too. A brilliant correlation rule does nothing if the field it depends on never gets parsed.
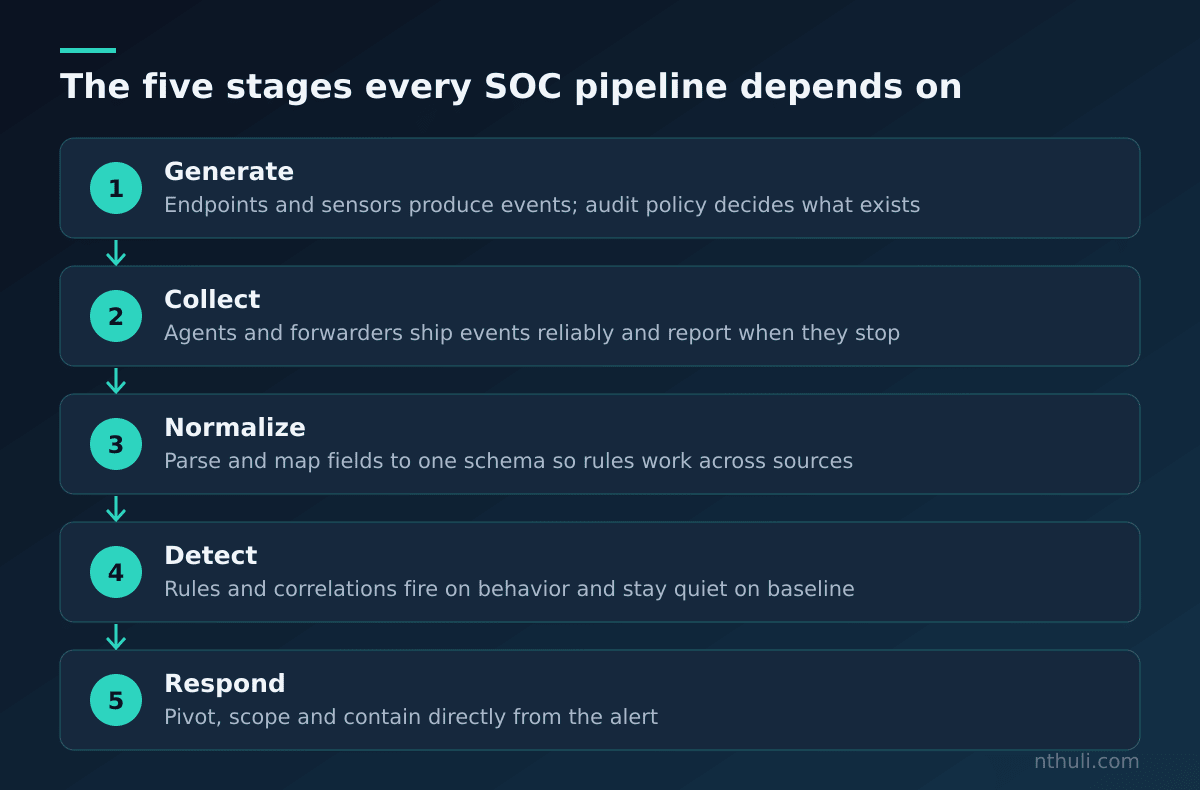
Treat each stage as something you can test on its own:
- Generate: does the endpoint or sensor actually produce the event? Plenty of Windows audit categories are off by default.
- Collect: does the event leave the host reliably, and do you find out when it stops?
- Normalize: are fields mapped the same way across sources, so
source.ipmeans the same thing for firewall, Zeek and Sysmon data? - Detect: does the rule fire on the behavior and stay quiet on normal activity?
- Respond: once it fires, can you pivot, scope and contain from the alert?
When something fails, this framing tells you where to look. “No alert” might be a detection problem. More often it’s a collection or parsing problem.
The reference layout
A practical lab fits on one decent hypervisor host with a separate storage-heavy VM for the SIEM. What matters more than hardware is network segmentation, because segmentation decides what your sensors can see.
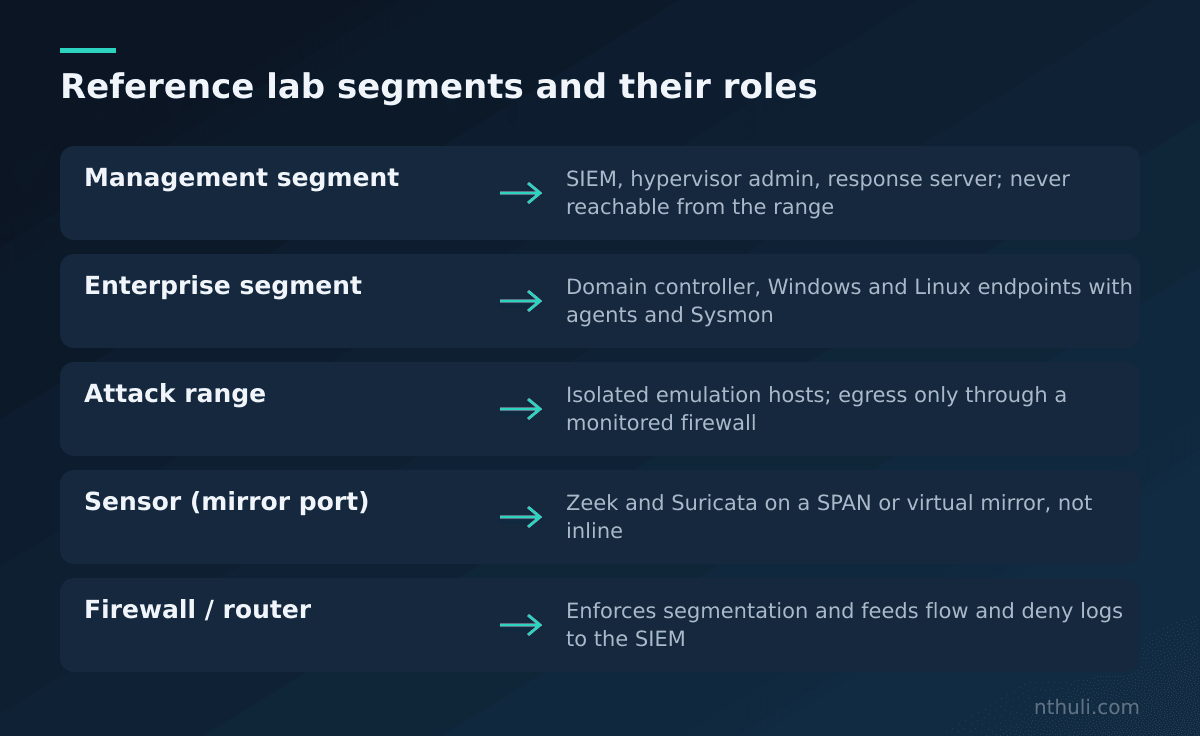
Key decisions:
- Put the attack range on its own segment. Your detonation and adversary-emulation hosts should not be able to reach your home network, and ideally can’t reach the internet without going through a monitored egress point.
- Mirror traffic to a dedicated sensor. A SPAN port on a managed switch or a virtual mirror on the hypervisor bridge gives Zeek and Suricata a copy of the traffic without putting them inline.
- Keep the SIEM on a management segment. Endpoints should be able to ship logs to it, but the attack range should never be able to manage it.
- Include a domain controller. A lot of interesting enterprise detection, like Kerberos abuse, group membership changes and lateral movement, only exists when there’s Active Directory to abuse.
Choosing the stack
You can build a capable lab entirely from open-source or free-tier components. Choose based on what you want to practice, not on what’s popular.
| Layer | Common open options | What it teaches |
|---|---|---|
| SIEM / search | Elastic Stack, Wazuh (OpenSearch-based), Graylog, Splunk free tier | Query languages, field mapping, retention trade-offs |
| Endpoint telemetry | Sysmon, Windows Event Forwarding, auditd, osquery | What process, file and network evidence really looks like |
| Network telemetry | Zeek, Suricata | Protocol metadata versus signature alerts |
| Response / forensics | Velociraptor | Hunting and live collection across many hosts |
| Detection content | Sigma rules | Writing detections that don’t depend on one vendor |
| Validation | Atomic Red Team, MITRE Caldera | Proving a detection fires, safely and repeatably |
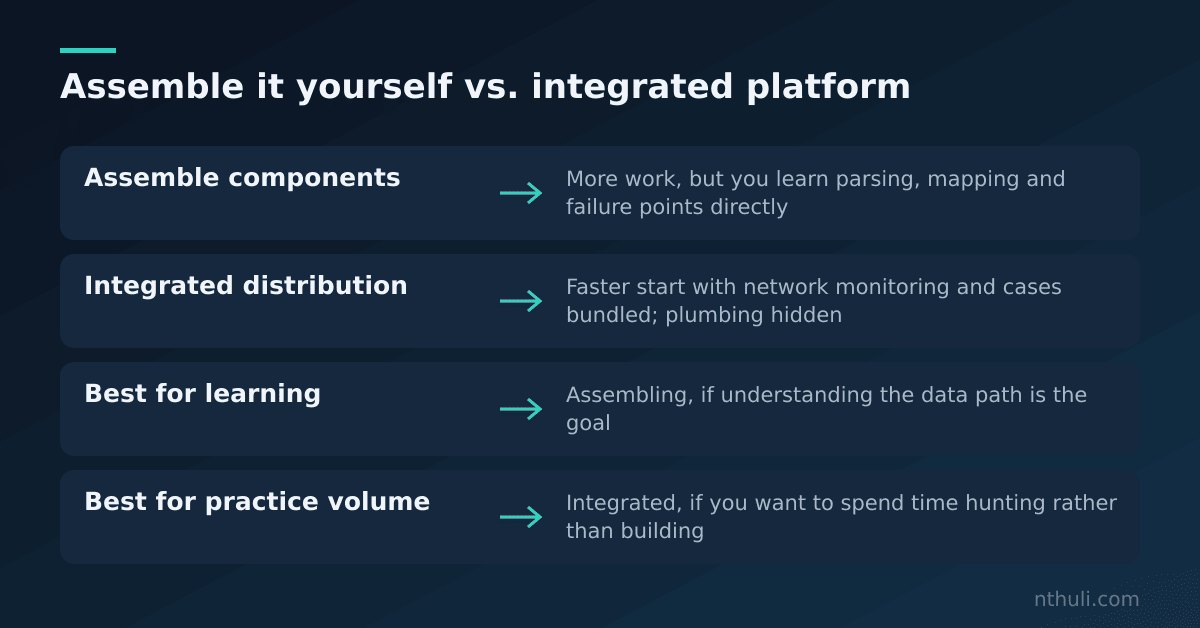
Security Onion is worth a look if you want much of this pre-integrated, since it bundles network monitoring, log management and case handling. The trade-off is that integration hides some of the plumbing. If learning the plumbing is your goal, assembling the pieces yourself teaches more.
Telemetry that earns its disk space
Storage is the constraint that kills most homelabs, so collect on purpose. A small set of high-value sources beats everything on default verbosity.
| Source | High-value events | Why it matters |
|---|---|---|
| Sysmon | Event ID 1 (process create), 3 (network connection), 10 (process access), 11 (file create), 22 (DNS query) | Parent-child process chains, credential access against LSASS, beaconing |
| Windows Security log | 4624/4625 (logon success/failure), 4688 (process creation), 4720 (account created), 4728/4732 (group membership added) | Authentication patterns and privilege changes |
| System log | 7045 (service installed) | A classic persistence and lateral movement artifact |
| PowerShell | 4104 (script block logging) | Captures deobfuscated script content at execution |
| Zeek | conn, dns, http, ssl, x509 logs | Who talked to whom, for how long, and with what certificate |
| Suricata | alerts, plus flow and protocol events | Known-bad signatures layered over metadata |
A few mechanics that matter:
- Use a tuned Sysmon config. The community-maintained configurations are a sensible baseline. Running Sysmon without filtering floods you with image-load and network events from noisy processes.
- Turn on command-line auditing if you rely on 4688. Without it, the event tells you a process started but not what arguments it got.
- Watch for silence. Make a rule that alerts when a host that normally reports has gone quiet. Losing an agent is the most common failure in any SOC, home or enterprise.
Normalization is where detections live or die
Detection logic is only as portable as your field names. If Sysmon sends Image, Wazuh sends data.win.eventdata.image, and your Linux hosts send exe, one rule can’t cover all three.
Pick a schema, such as Elastic Common Schema or the field model your SIEM prefers, and map everything to it on ingest. Then write detections in Sigma and convert them to your backend’s query language. That gives you two benefits:
- Your rules survive a SIEM migration.
- Converting Sigma forces you to check whether the fields a rule expects actually exist in your data. That makes it a good way to audit your parsing.
The detection lifecycle
This is the part that turns a lab into training. Every detection should go through the same loop, and you should be able to rerun it whenever something changes.
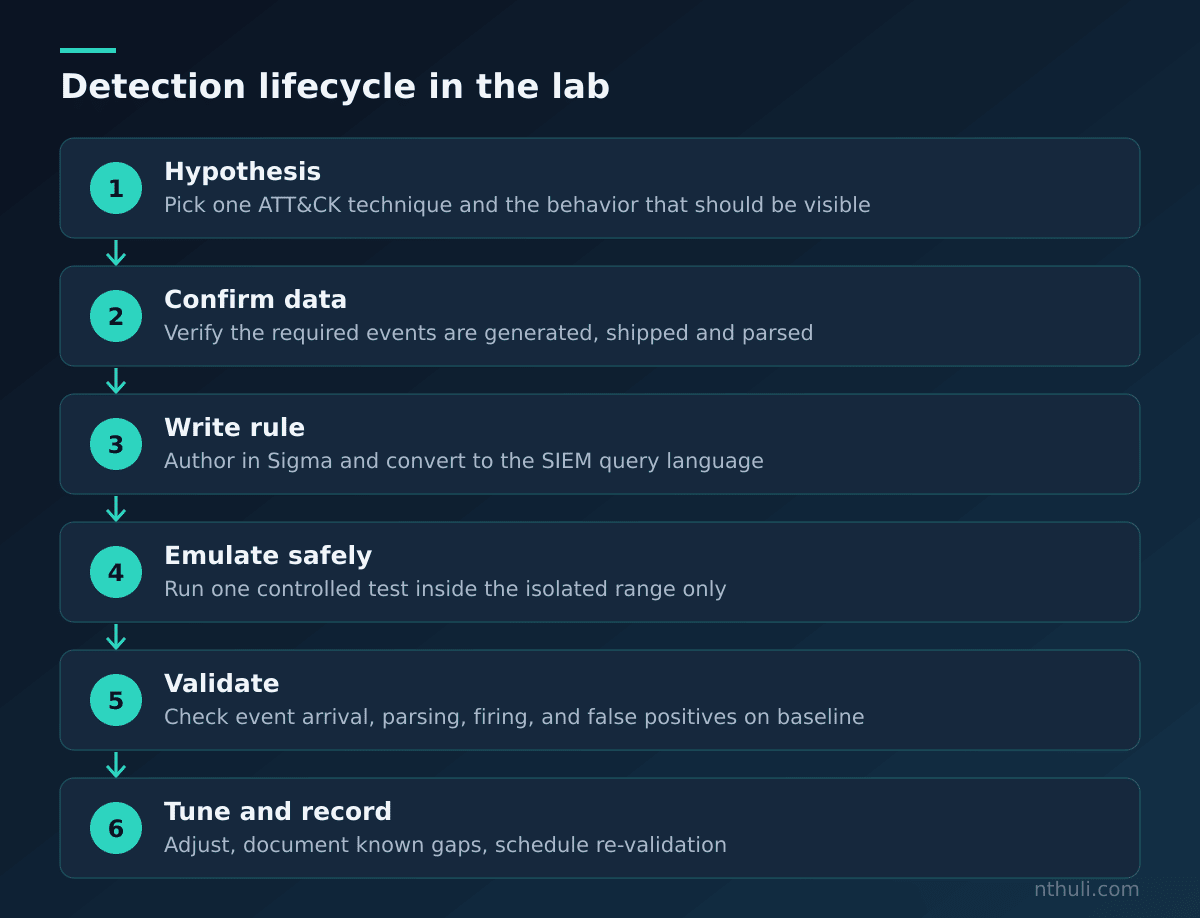
The validation step is where most of the learning happens. Run a controlled emulation of one technique, such as a single Atomic Red Team test mapped to a MITRE ATT&CK technique, only inside the isolated range. Then check four things:
- Did the raw event arrive?
- Were the fields parsed correctly?
- Did the rule fire?
- Did it fire only on the malicious activity, or also on the benign baseline?
A failure at any one of these tells you something different. Note which step broke. Over time, that record becomes a map of your blind spots.
Measuring coverage honestly
It’s tempting to color in an ATT&CK matrix and call it coverage. Resist that. A technique counts as covered only if you have validated a detection against it, and only for the specific procedures you tested. One technique can be carried out in many ways.
A simple tracking table keeps you honest:
| Technique (ATT&CK) | Data source | Rule status | Last validated | Known gaps |
|---|---|---|---|---|
| T1059.001 PowerShell | Sysmon 1, PS 4104 | Validated | (your date) | Obfuscated variants untested |
| T1003.001 LSASS Memory | Sysmon 10 | Validated | (your date) | Tuned for common access masks only |
| T1543.003 Windows Service | System 7045 | Draft | — | No baseline of legitimate installs yet |
| T1071.004 DNS C2 | Zeek dns, Sysmon 22 | Not started | — | Need long-term query baselining |
The “Known gaps” column matters most. It’s where you write down your assumptions, which is the habit that separates detection engineering from writing rules.
Response: closing the loop
An alert that leads nowhere is just a notification. Build at least a minimal response path:
- Pivoting: from any alert, can you get to the host’s process tree, network connections and logon sessions within a few clicks or queries?
- Live collection: a tool like Velociraptor lets you query endpoints for artifacts such as autoruns, scheduled tasks and prefetch, without RDP-ing into a possibly compromised box.
- Containment: practice isolating a host at the firewall or hypervisor level. Knowing exactly how you’d cut a machine off is worth more than any dashboard.
- Case notes: write a short record of each validation run, covering what fired, what didn’t, and what you changed. Even a markdown file will do.
Keeping the lab alive
Homelabs decay quietly. Build in maintenance from day one:
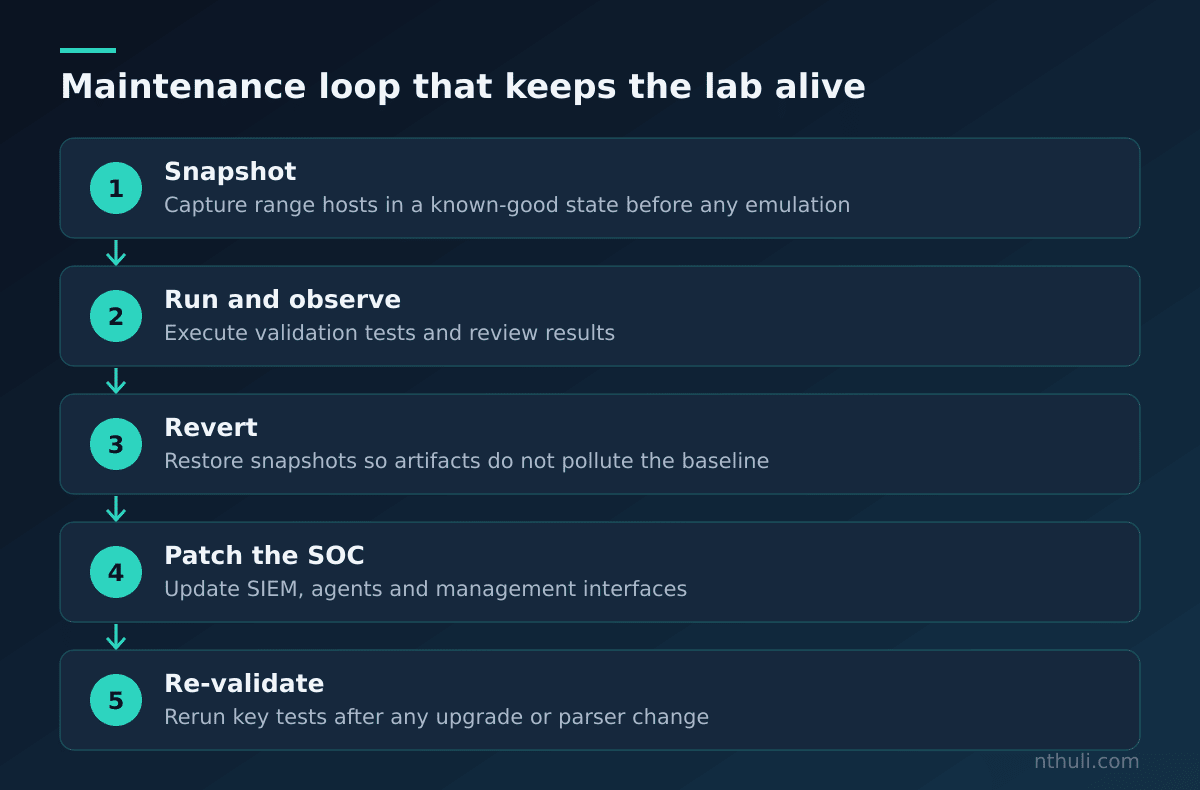
- Snapshot before detonation and revert after, so the range stays in a known state.
- Set retention deliberately. Keep raw logs briefly and keep alerts and case notes longer.
- Patch the SOC itself. Your SIEM and management interfaces are the most valuable targets in the lab. Never expose them to the internet.
- Re-validate after changes. A SIEM upgrade, a new Sysmon config or a parser tweak can quietly break rules that used to work.
What to learn from this
- Build a pipeline, not a product collection. Test generation, collection, normalization, detection and response separately so you know where a failure happened.
- Silence is an alert. Detecting a host that stopped reporting catches more real problems than most fancy correlation rules.
- Normalize early and write in Sigma. Portable rules and a consistent schema let you change tools without starting over.
- Coverage means validated coverage. A technique counts only after a controlled emulation has proven your rule fires, and you’ve written down the gaps.
- Isolate the range and protect the SOC. Segmentation decides both what you can see and what an emulated attacker could reach.